

Part Three: Lissajous Curves
By: Mary Wisniewsky
Take a look at Assignment 10: Parametric Equations.
In this assignment, we took a look at the following graph:
x(t)= sin at
y(t)= cos bt
such that 0 ≤ t ≤ 2π
Here is one of the graphs we displayed in that assignment to show how a and b vary the graph:
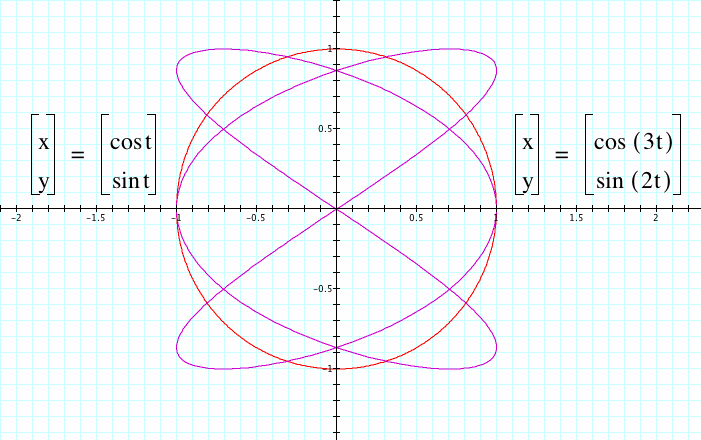
When a and b change, the number of spirals horizontally and vertically are affected.
Here also is a video as a and b are varied.
Let's relate these parametric eqn curves to the following parametric curves:
x(t) = 4 sint (a/b)t
y(t) = 3 sin t
As a and b vary, these set of curves are called Lissajous Curves after a French Mathematician named Jules Antoine Lissajous who studied waves and optics and related subjects.
Let's take a look at various forms of a,b where a<b.
Lets start with a=1, b=2. Then increase these values and let a's value increase closer and closer to b's.
( 0 ≤ t ≤ 50 )

Here, we have a bow-tie shape or a side ways figure-8 with two horizontal curves.
As we increase our values for a & b and get them to be closer in value (approaching 1), are we going to see more or less curves similar to the original form of this equation?
Let's examine the graphs with the following a,b values and compare it to this top graph:
a=1, b=4
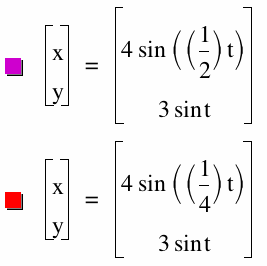
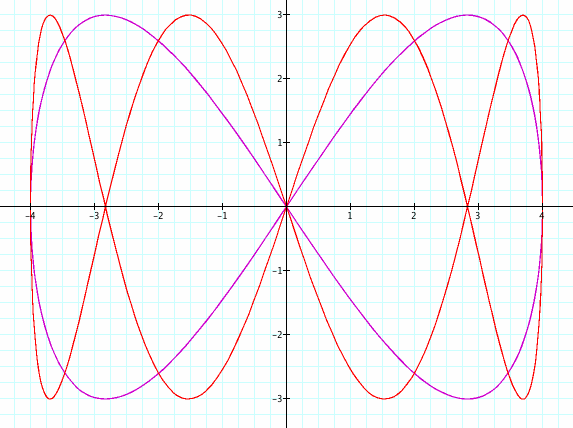
So when we increased b, more curves were created horizontally and the two middle curves are expanded more than the outer curves.

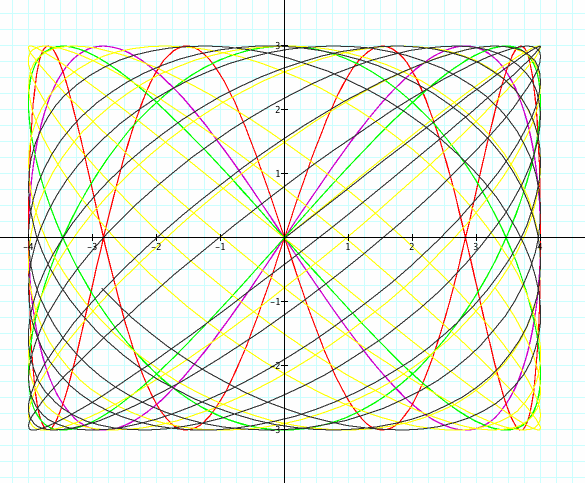
As a and b increase values and come closer to (a/b)=1, more curves are represented. Now what happens to the graph as (a/b) almost approaches 1?
(Take a look at this animation)
This animation shows the parametric curves when a=n and b=10 such that 9 ≤ n ≤ 10.
As n reaches closer to 10 the graph shrinks closer to form "spiral ellipses" and then collapses to a straight line when n=10 so that (a/b)=1.
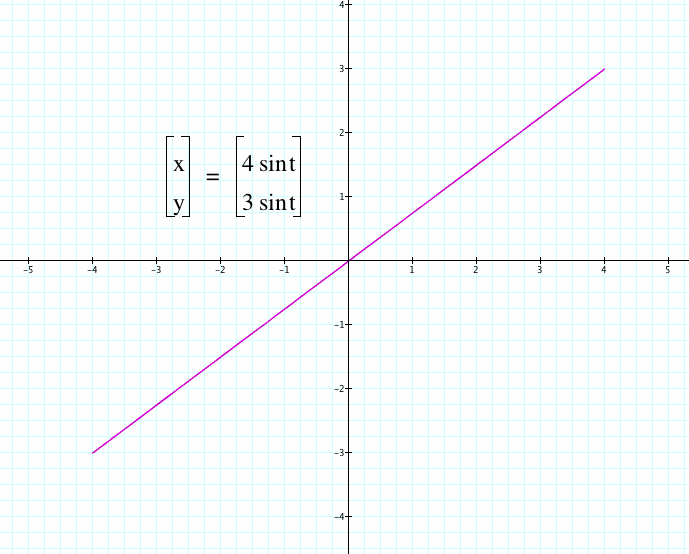
When exploring these type of curves, you can create various forms of waves that are quite unique which mimics Lissajous' interest for waves and optics:
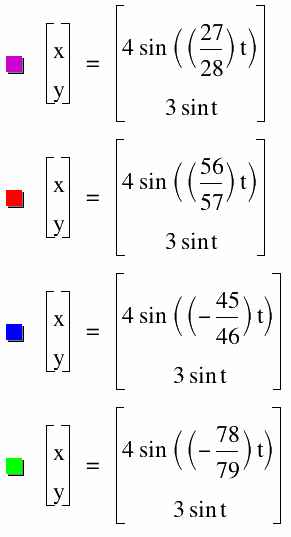
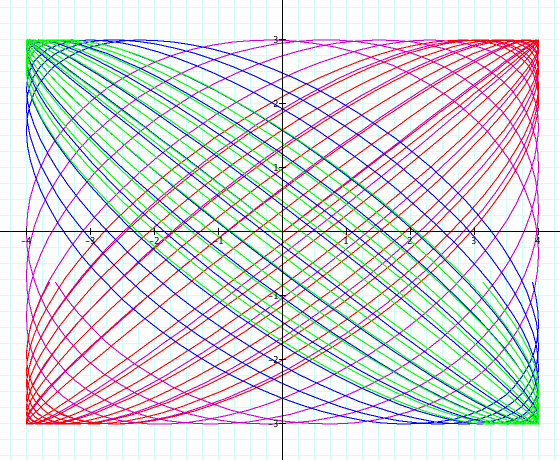
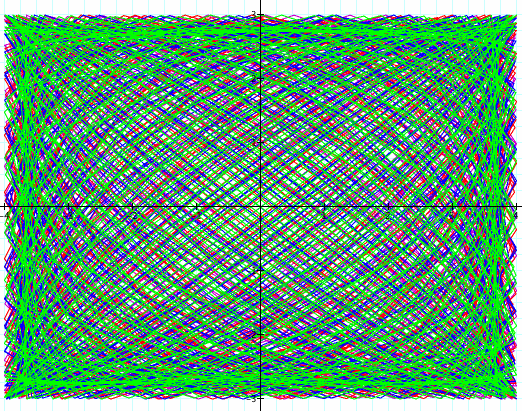
The top graph is when the interval is kept the same as the above and the one below it has an interval of 0 ≤ t ≤ 500.
The bigger t becomes, the more cycles are produced and overlapped to create what is above.
When you make (a/b) negative, as you can see in the both graphs, the curves are just rotated 90 degrees.
And again you can see as (a/b) becomes closer to 1 (or -1), the ellipse spiral shrinks closer to a straight line.
After watching the animation, it is similar to accordion going in and out.
Use the following Graphing Calculator Application Link to explore further into Lissajous Curves!
Return to Mary Wisniewsky's Final Project Page